How to build a meaningful AI search visibility dashboard

An AI search dashboard should show more than whether ChatGPT, Gemini, Perplexity, or Google AI Overviews have sent traffic to your site. It should help you understand where your brand appears, which pages and sources AI systems cite, which prompts surface your competitors, and whether AI-driven visibility is turning into traffic, leads, or revenue.
Still, AI search measurement is incomplete. Some signals can be tracked in Google Analytics 4, SEO platforms, log files, and AI visibility tools, but these systems are limited. You still can’t see if every AI-generated answer, citation, app-based click, or journey starts with an AI assistant.
The goal of a dashboard is not perfect attribution. It’s to build a practical AI traffic report that helps you make better decisions about content strategy, authority, technical accessibility, and brand visibility as AI search continues to evolve.
Which metrics to include in your AI traffic reports
No single tool or metric will give you a complete view of AI search performance yet. For example, many AI interactions happen without a click, and some AI tools don’t pass clean referral data.
Also, some citations appear inside AI answers without producing a session, and some users may discover your brand in an AI assistant, then return later through branded search, direct traffic, email, or paid search.
Even though the full AI picture will be incomplete, here are some helpful tools and metrics for tracking AI search:
- Google Analytics 4 can show some referral traffic from AI assistants
- AI visibility tools (Peec, Profound, Otterly, just to mention a few) can show statistics around mentions, citations, prompts, sentiment, and share of voice
- Log file data can show how often AI crawlers access your site
- Customer relationship management (CRM) or analytics platforms can show whether that activity contributes to leads, sales, or assisted conversions
Because AI-generated answers vary by model, prompt, location, freshness, and context, you won’t be able to measure visibility with perfect precision. The goal is to identify useful patterns: where your brand appears, where competitors are strong, which prompts or topics matter commercially, and which content or authority gaps should be prioritized.
Use a dashboard to answer practical questions like:
- Are AI systems mentioning our brand?
- Are they citing our pages or third-party sources?
- Which prompts and topics are we visible for?
- Which competitors appear more often than we do?
- Are AI tools sending any referral traffic?
- Are AI crawlers accessing our content without sending users back?
- Is AI-assisted discovery contributing to conversions?
Core metrics for an AI search dashboard
Use this table to understand what each metric tells you and which decision it should support.
| Metric | What it shows | How to use it |
| Referral traffic from AI channels | Sessions, users, engagement, and conversions from tools such as ChatGPT, Gemini, Perplexity, Copilot, Claude, and other AI assistants when referral data is available. | Track whether AI platforms are sending measurable visits, which pages receive them, and whether those visits contribute to conversions. |
| AI mentions | How often your brand, product, content, or competitors appear in AI-generated answers. | Monitor whether your brand is part of the answer set for important prompts, even when you are not cited or clicked. |
| Citations | Which URLs AI systems cite as sources in generated answers. | Identify whether AI systems cite your own content, competitors, publishers, review sites, forums, or other third-party sources. |
| Position in AI results | Where your brand or URL appears inside an AI answer when the tool reports position. | Compare visibility quality, not only visibility volume. A brand used as the main recommendation has a different value than one mentioned near the end. |
| AI share of voice | Your visibility compared with competitors across a defined set of prompts, topics, or markets. | Benchmark whether you are gaining or losing visibility in AI search environments over time. |
| Sentiment | Whether AI-generated answers describe your brand positively, negatively, or neutrally. | Find messaging, reputation, or positioning issues that may affect how users understand your brand. |
| Prompt and topic coverage | Which questions, use cases, categories, and topics trigger your brand or content in AI answers. | Find content gaps, weak topic clusters, and opportunities to improve pages that should be retrieved more often. |
| Source mix | The types of sources AI systems rely on when answering questions about your category. | Understand whether AI answers are influenced by your website, competitors, review sites, publishers, marketplaces, communities, or documentation. |
| Crawl-to-refer ratio | The relationship between AI crawler activity and referral traffic from AI platforms. | Identify whether AI systems are consuming your content without sending meaningful traffic back. |
| Assisted conversions | Whether sessions from AI assistants contribute to leads, sign-ups, purchases, or other conversion events. | Connect AI discovery to business outcomes, while recognizing that many AI-influenced journeys won’t be perfectly attributed. |
Referral traffic from AI channels via GA4
The AI search data you can measure most directly is referral traffic.
In Google Analytics 4, you can track sessions and conversions from AI assistants when they pass referral information. Google Analytics now includes an AI Assistant default channel group for traffic from recognized AI chatbot referrers, including ChatGPT, Gemini, and Claude. This makes AI referral traffic easier to separate from broader referral, organic, and direct traffic.
But treat this data as a partial view. GA4 can show visits that arrive with recognizable referral data, but it can’t show every AI answer that mentioned your brand, every citation that didn’t lead to a click, or every user who discovered you in an AI assistant and returned later through another channel.
In your dashboard, use GA4 AI referral data to track:
- Sessions from AI assistants
- Engaged sessions from AI assistants
- Landing pages receiving AI referral traffic
- Conversions from AI referral traffic
- Conversion rate by AI source
- Revenue or pipeline influenced by AI referral traffic, where available
- New vs. returning users from AI channels
These metrics will tell you which AI tools are already sending measurable traffic and whether that traffic behaves differently from other channels. They can also show you:
- Content AI users are discovering first
- Pages that need stronger conversion paths
- Where to add clearer calls to action
For example, an AI assistant may send low traffic volume but high-intent users. Or it may send users to unexpected pages, such as help center content, comparison pages, glossary entries, documentation, or thought leadership articles.
In Semrush, you can access similar data in the “Traffic Analytics” section under “Traffic & Market.” This view will help you see where AI referral traffic is coming from, which pages it reaches first, and how users behave after landing on your site. Use it to make clearer content and conversion decisions.

Crawl-to-refer ratio (CRR)
This metric compares AI crawler activity with referral traffic from AI tools. It will help you understand how often AI crawlers access your content compared to how often AI platforms send users back to your website, for example, through citations, source links, product links, or other clickable references in AI-generated answers.
A high crawl-to-refer ratio can suggest that an AI system is consuming a lot of content as an input, but not sending many users to the original pages.
Cloudflare has published crawl-to-refer ratio data that shows how often AI models send traffic to a site compared to how often they crawl it. Other research from the company also shows large differences between AI crawlers — some systems crawl far more often than they refer users back to publishers.
Use the crawl-to-refer ratio to decide:
- Which AI crawlers access your site most often
- Whether crawler activity is increasing without referral traffic growth
- Whether server load or crawl waste is becoming a concern
- If robots.txt rules, AI crawler policies, or content access rules need review
- Whether certain content sections are being crawled more heavily than others
This metric is especially useful for publishers, large content sites, ecommerce sites, SaaS documentation libraries, and brands with high-value proprietary content because these sites invest heavily in content that AI systems may crawl, summarize, or use as source material.
The crawl-to-refer ratio helps them understand whether that activity is translating into visits back to their own pages, or whether AI crawlers are consuming content without creating proportional traffic, attribution, or business value.
How to build your own crawl-to-refer ratio
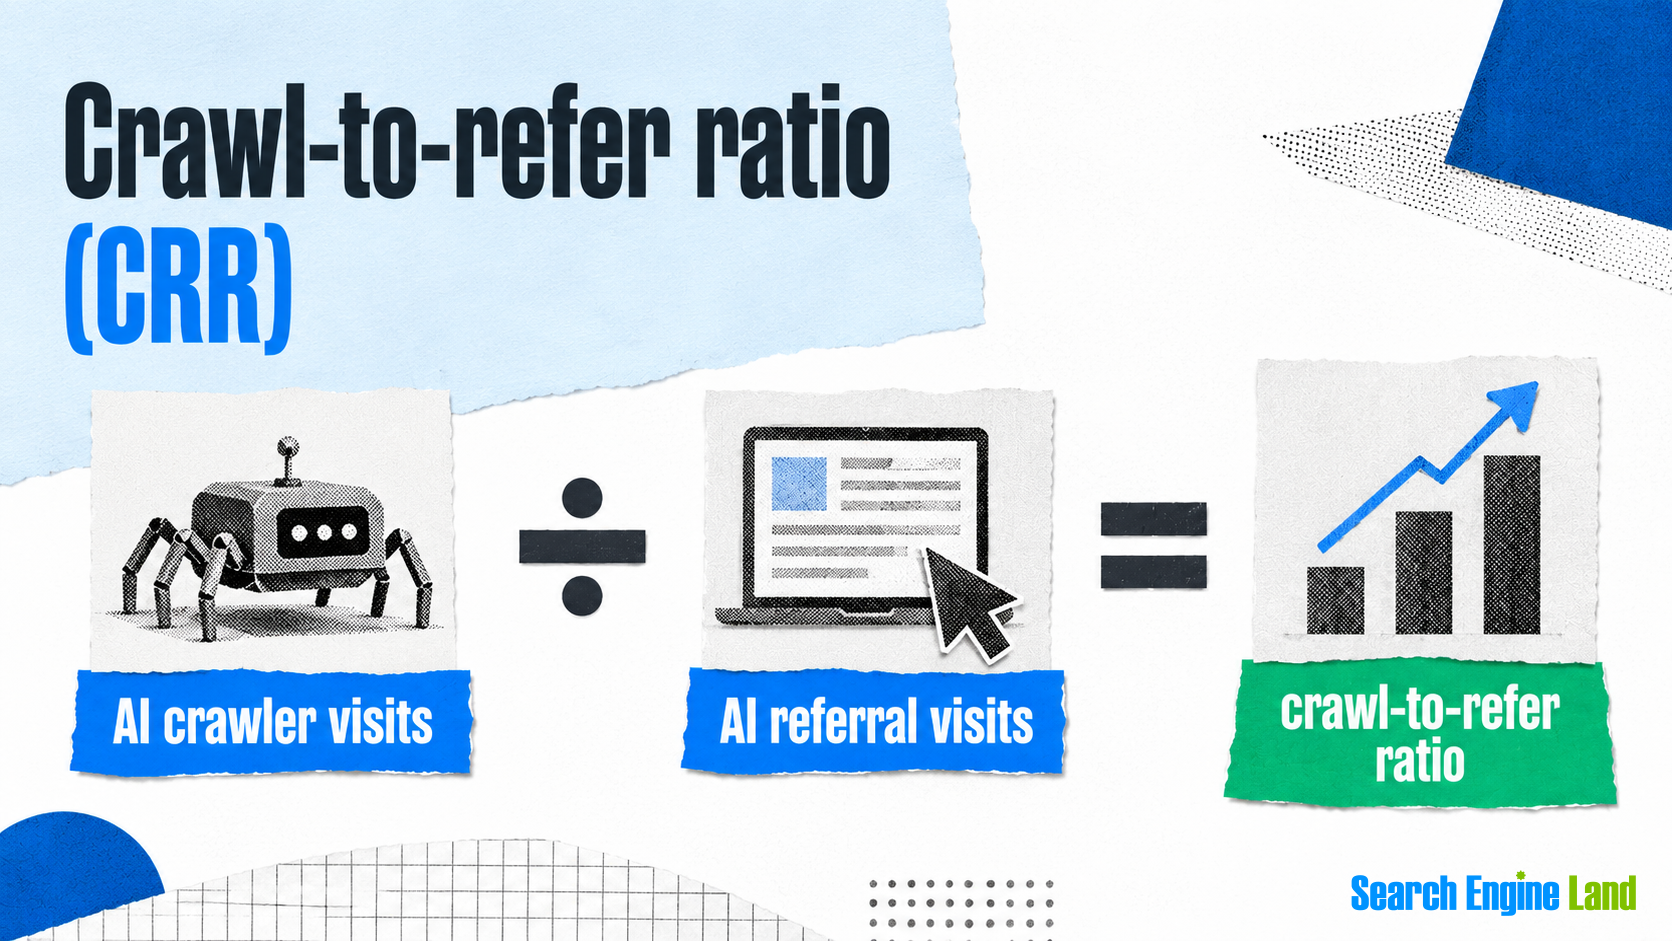
Use your server log files to identify visits from known AI crawlers. These tools can help you process that data and spot crawler activity.
Then compare those crawler visits with AI referral visits from GA4 or the “Traffic & Market” tab in Semrush.
The formula is simple:
AI crawler visits / AI referral visits = crawl-to-refer ratio
For example:
If an AI crawler hits your site 10,000 times in a month and the same AI ecosystem sends 100 referral visits, the crawl-to-refer ratio would be 100:1.
That doesn’t mean the crawler is bad — some crawling may support discovery, indexing, model grounding, search features, or future retrieval. But it does give you a useful signal.
AI search visibility metrics
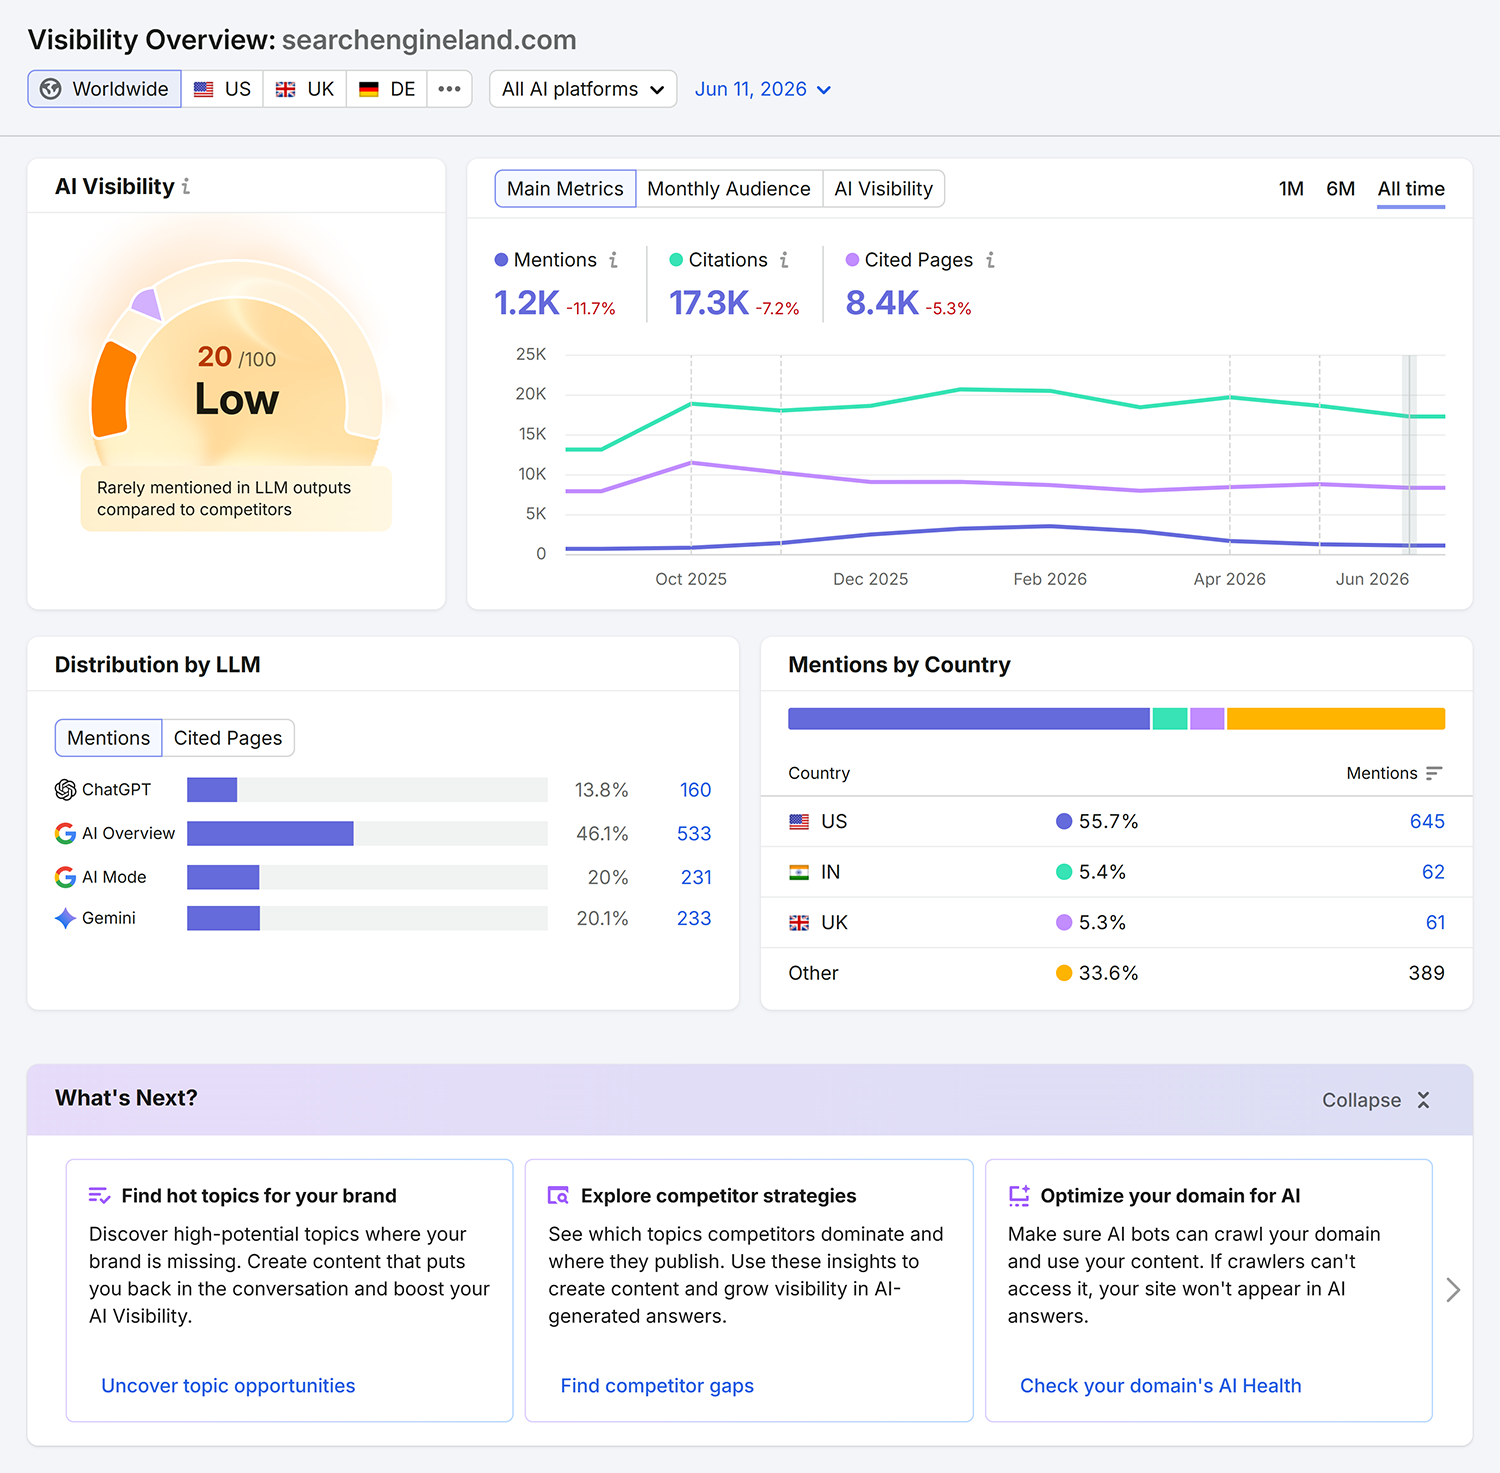
AI visibility metrics can help you understand whether AI systems see your brand as relevant, authoritative, and retrievable for the topics that matter to your business.
Referral traffic and crawl data are useful, but they miss a large part of AI search visibility because many interactions don’t produce a click. A user may query an AI assistant, and the answer may mention your brand, cite your page, summarize your positioning, or compare you with competitors. Or, it could exclude you completely.
Useful metrics include:
- Mentions: How often your brand appears in AI-generated answers
- Citations: Which URLs are used as sources
- AI share of voice: How often you appear compared with competitors
- Position: Where you appear in the answer
- Sentiment: How positively or negatively the answer describes your brand
- Prompt coverage: Which prompts and topics trigger your brand
- Competitor visibility: Which competitors appear when you don’t
- Source overlap: Which websites AI systems rely on across your category
These metrics help solve two different problems:
- Visibility: When AI systems don’t mention your brand for important prompts
- Retrieval: When AI systems mention your brand but cite third-party sources, competitors, outdated pages, or low-quality summaries instead of your preferred content
These require different solutions:
- A visibility problem may require stronger topical coverage, brand authority, digital PR, reviews, comparison content, and better alignment with how users ask questions.
- A retrieval problem may require clearer page structure, stronger entity signals, better internal linking, fresher content, improved schema, better source credibility, or content that answers the prompt more directly.
Dig deeper: For more context on how AI visibility metrics fit into modern SEO reporting, read our guide to new SEO KPIs.
Data export and extraction methods
AI search data needs to be pieced together manually. That means combining data from Google Analytics 4 (GA4), log files, AI visibility tools, SEO platforms, and customer relationship management (CRM) or conversion data.
But this creates three problems:
- Data lives in different tools
- Metric definitions don’t always match
- Manual exports can become inconsistent over time
A platform dashboard can remove a lot of this manual work. For example, Semrush’s AI Visibility dashboard can centralize many AI visibility metrics.

It’s important to know what to track, and how you will extract, clean, and refresh the data. If you want to create your own reporting layer, below are the main extraction methods to consider.
To summarize the methods:
- Use PDF exports when you need stakeholder-ready summaries
- Use CSV exports when you need flexibility
- Use the API when you need repeatable reporting at scale
- Use the native dashboard when you need the fastest route from data to decision
Export PDFs
PDF exports are useful when you need a recurring report for stakeholders, clients, or executives. They work best for presentation, rather than analysis. Use PDF exports when you need a readable report. Don’t rely on them as your main data pipeline unless you have a review process in place.
For example, you can use Semrush’s report automation to schedule a PDF report and have it emailed automatically on a weekly or monthly cadence.
This can be useful when stakeholders need a consistent snapshot of AI visibility, citations, sentiment, competitor presence, and referral traffic without logging into multiple tools.
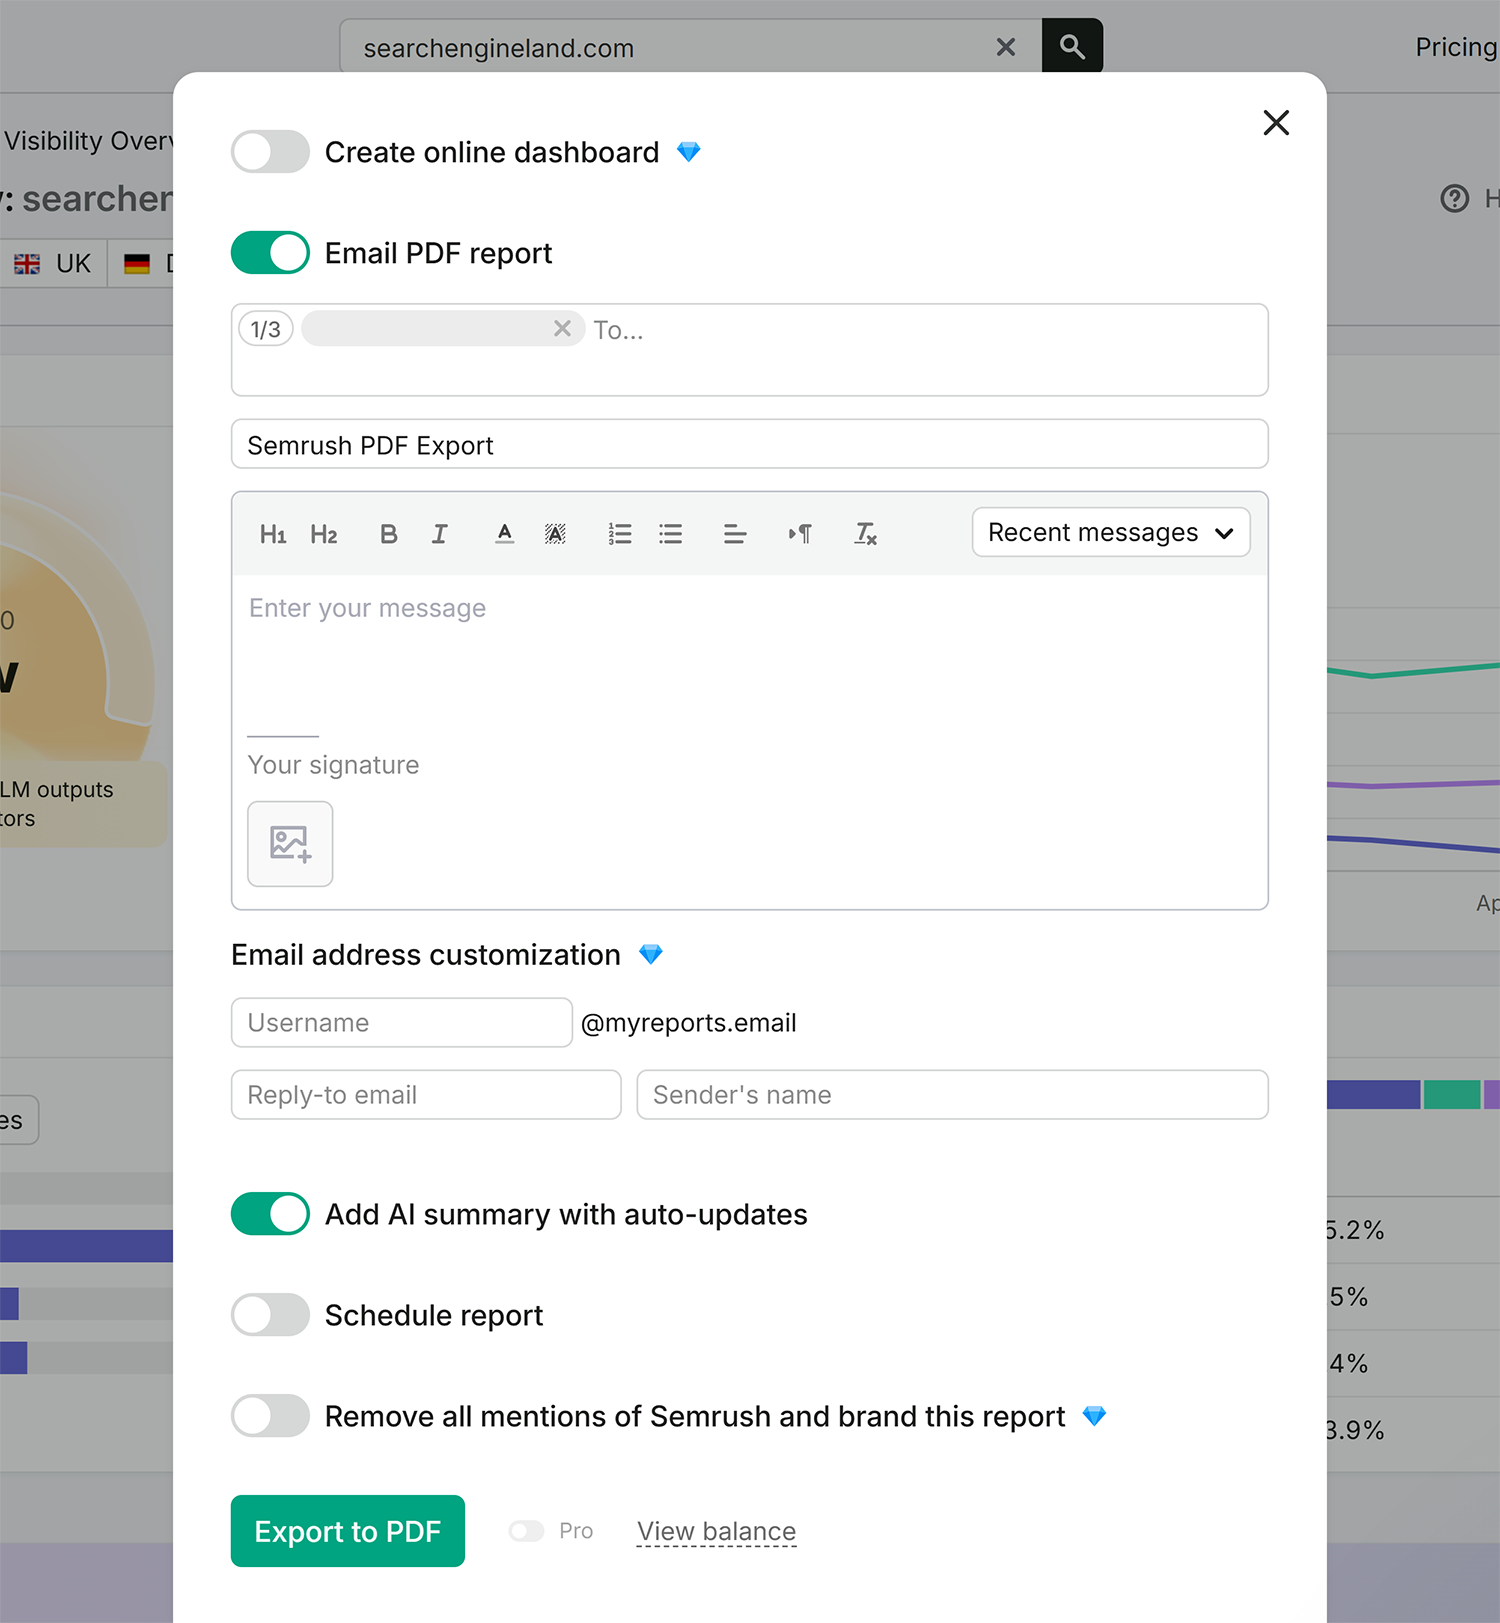
PDFs are especially useful when the report needs to answer questions like:
- Did our AI visibility improve this month?
- Which competitors appeared more often?
- Which pages or sources were cited?
- Which AI tools sent measurable referral traffic?
- Did sentiment change across important prompts?
However, another limitation: You can ask an AI tool to extract tables from a PDF and convert them into a comma-separated values (CSV) file, but the formatting may be inconsistent. Rows can shift, headers can be misread, and percentages, dates, and source names may need manual cleanup.
Export CSVs
CSV exports are useful when you want to build a custom AI search dashboard in Data Studio, Google Sheets, BigQuery, Tableau, Power BI, or another reporting tool. They give you structured data you can clean, blend, and visualize.
These are great options if you want to combine AI visibility data with other sources, such as:
- GA4 referral traffic
- Search Console query and landing page data
- Log file data
- CRM leads or pipeline
- Revenue data
- Content inventory data
- Competitor tracking data
For example, you can:
- Compare AI citations with organic landing pages
- See whether pages that receive AI referral traffic also rank well in Google Search
- See whether prompts that mention your competitors overlap with topics where your content is thin
In Semrush, you can export several AI visibility datasets into CSV format for custom reporting, including:
- Topics and Sources from the “Visibility Overview” tab
- Topics and Prompts from the “Competitor Research” tab
- Related topics from the “Prompt Research” tab
- AI Feature Descriptions from the “Perception” tab
- Breakdown by Question from the “Narrative Drivers” tab

Once you export the files, standardize them before adding to a dashboard — AI search reporting can get messy quickly. Without consistent naming, your dashboard will become hard to trust. A simple taxonomy will make the data easier to compare month over month.
At a minimum, add consistent fields for:
- Date
- Market
- Language
- AI platform
- Prompt or topic
- Brand
- Competitor
- URL
- Source type
- Metric name
- Metric value
Semrush API
An API is the best option when you want AI search data to flow into a reporting system automatically. But keep in mind that most programs have limitations.
For example, the Semrush API can support some AI-related reporting, but it does not currently replace every AI visibility export or every dashboard view.
The best cases to use an API are when:
- Benchmarking traffic from AI assistants and AI-powered search engines
- Comparing AI-driven traffic against competitors
- Monitoring AI-powered search features such as Google AI Overviews or Bing’s Ask AI, which are supported through search feature tracking
- Pulling broader SEO, traffic, ranking, and competitive data into your reporting system
But if your main goal is to export every AI visibility metric, such as prompts, citations, sentiment, answer position, narrative drivers, and source-level analysis, you may still need CSV exports or a native dashboard.
How to visualize your AI search data
Once you know which metrics you want to track, the next step is choosing how to visualize them. Your AI search dashboard should help you answer three questions:
- What is changing?
- Why is it changing?
- What should we do next?
Here’s an overview of key elements to include in your dashboard.
| Dashboard view | Recommended widgets |
| Executive overview | AI referral traffic, AI share of voice, citations, competitor visibility, and assisted conversions. |
| Content performance | Pages cited by AI systems, pages receiving AI referral traffic, pages crawled by AI bots, and content gaps by prompt or topic. |
| Competitor visibility | Competitor mentions, competitor citations, prompt overlap, source overlap, and sentiment comparison. |
| Technical monitoring | AI crawler activity, crawl-to-refer ratio, blocked crawlers, server response codes, and high-crawl sections of the site. |
| Business impact | AI-assisted conversions, AI referral conversion rate, revenue or pipeline influenced by AI referrals, and top converting landing pages. |
There are two practical options to help you create a dashboard: Google Data Studio or Semrush’s AI Visibility dashboard.
If you want a flexible dashboard that combines several data sources, use Google Data Studio. If you want a faster setup with less manual work, use the native reporting interface inside Semrush’s AI Visibility dashboard.
Google Data Studio
Google Data Studio is useful when you want to combine AI search data with other marketing and business data.
For example, you can blend AI referral traffic from Google Analytics 4 (GA4), organic search performance from Google Search Console, exported AI visibility data from CSV files, and conversion data from your customer relationship management (CRM) system.
Data Studio gives you more control over the dashboard’s structure because you can create separate pages for:
- AI referral traffic
- AI citations and mentions
- Prompt and topic coverage
- Competitor visibility
- AI crawler activity
- Assisted conversions
- Content opportunities
This setup is especially useful if your team already uses Data Studio for SEO, paid search, content, or executive reporting.
However, although Data Studio gives you flexibility, it also requires maintenance. CSV files need to be updated, field names need to stay consistent, and data sources can break, especially when AI visibility data has to be imported manually rather than through a native connector.
A simple dashboard could include:
- AI referral sessions by source
- AI referral conversions by landing page
- AI mentions by prompt category
- AI citations by URL
- Competitor share of voice by topic
- Crawl-to-refer ratio by AI crawler
- Top content opportunities by prompt gap
- Assisted conversions from AI referral traffic
There are also community templates that can help you get started with AI referral reporting in Data Studio. Steve Toth’s LLM Traffic Dashboard can be a useful starting point if you want to test AI referral reporting before building your own template.

Semrush AI Visibility dashboard
The fastest way to visualize AI search data is to use the native dashboard and reporting tools inside Semrush, especially when you don’t want to export AI visibility data manually, rebuild charts in another tool, or manage CSV-based workflows.
This works well when you need to connect AI visibility monitoring with broader SEO and competitive analysis. Semrush already organizes data around topics, prompts, competitors, citations, sources, and reporting, so it can help teams move from isolated AI search checks to a repeatable workflow for tracking visibility, explaining changes, and sharing updates with stakeholders.
Here are some of its key functions:
- Share AI visibility performance with stakeholders
- Monitor brand and competitor visibility over time
- Track prompts, topics, citations, and source trends
- Build repeatable reports without managing CSV exports
- Schedule reports to be emailed automatically
- Combine AI visibility widgets with other SEO and traffic data
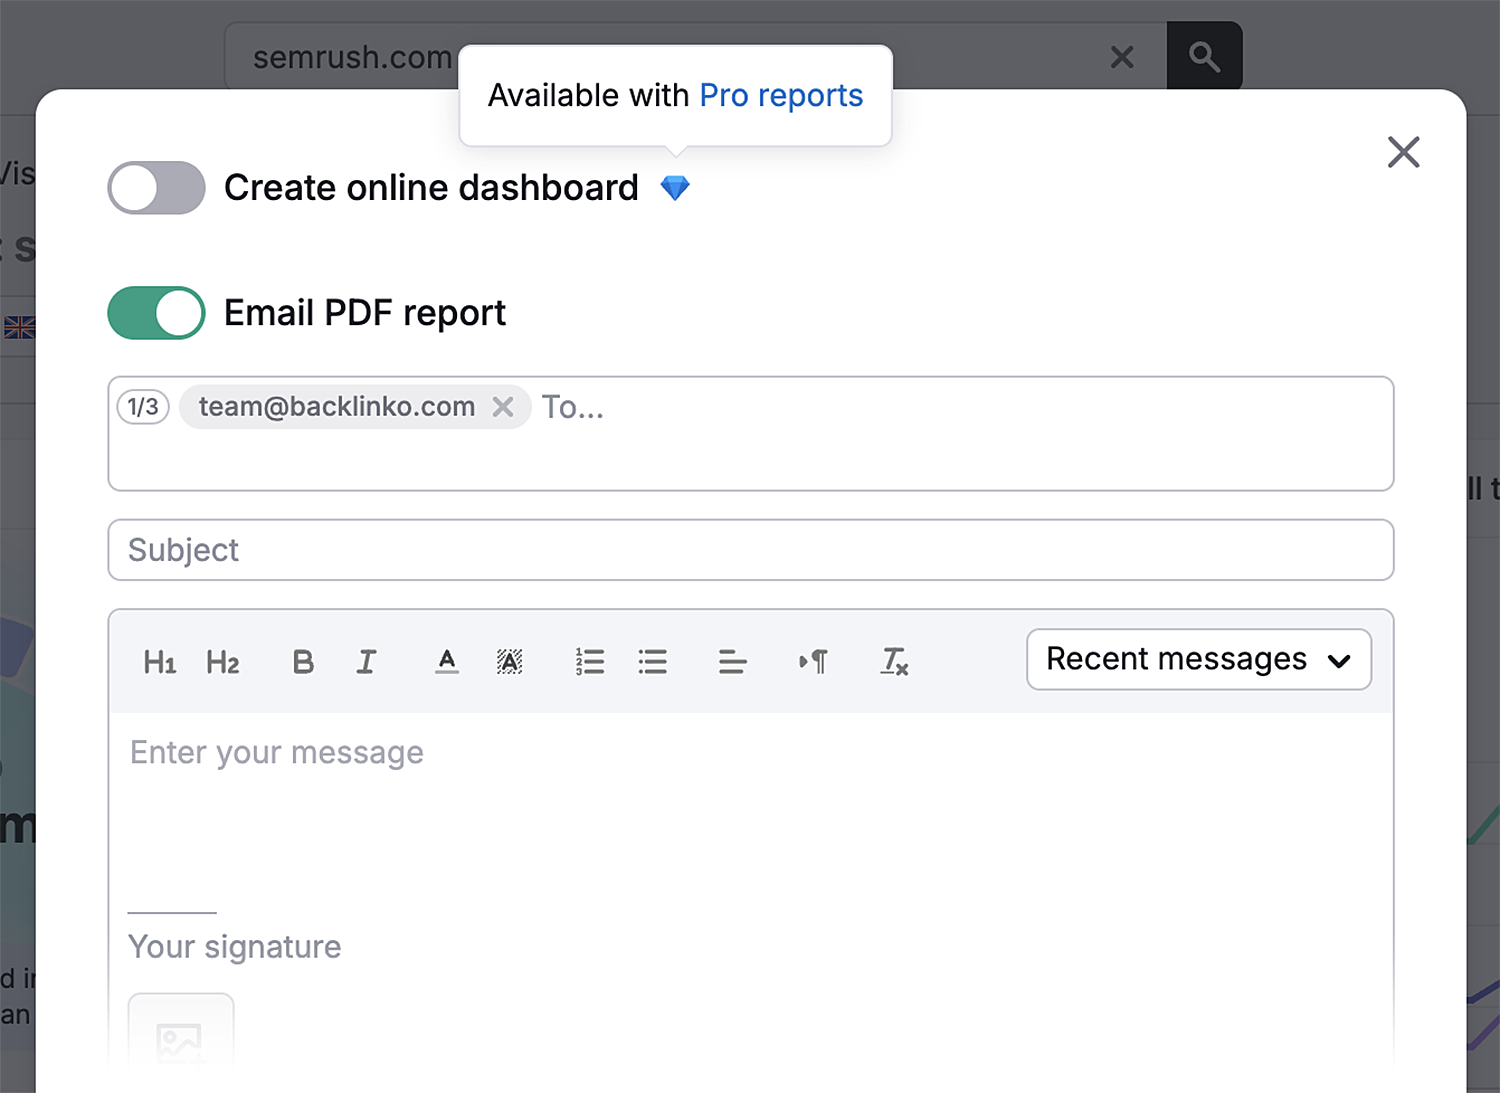
You can also schedule reports so stakeholders receive updates automatically. And you can use reporting integrations to combine Semrush data with other sources.
A useful Semrush-based AI visibility dashboard might include:
- AI share of voice trend
- Brand mentions
- Competitor mentions
- Cited domains and URLs
- Prompt-level visibility
- Topic-level visibility
- Sentiment trend
- AI referral traffic
- Top sources influencing AI answers
- Opportunities where competitors appear and you do not
This type of view is less flexible than a fully custom business intelligence dashboard, but it is easier to maintain.
Use your AI search dashboard to make better decisions
AI search reporting is imperfect, but it’s still worthwhile to build a dashboard to track its metrics.
Start with signals you can track now: AI referral traffic, citations, mentions, share of voice, sentiment, crawler activity, and assisted conversions. Then organize those signals around the decisions your team needs to make, answering questions such as:
- Which content should you update?
- Which topics are competitors winning?
- Which sources are AI systems citing?
- Which pages attract AI referral traffic but fail to convert?
- Which crawlers are accessing your content without sending users back?
A meaningful AI search dashboard report shows you what has happened and helps you decide what to improve.
The real value comes from turning insights into action: clearer content, stronger authority signals, better technical access, more useful comparison pages, and stronger conversion paths for users who discover you through AI search.
For teams that want to avoid manual exports, Semrush can help you build an AI Visibility dashboard, share reports with stakeholders, and schedule updates to be emailed automatically.
Explore more on
Editorial disclosure
Search Engine Land is owned by Semrush. We remain committed to providing high-quality coverage of marketing topics. Unless otherwise noted, this page’s content was written by either an employee or a paid contractor of Semrush Inc.
About the author