Google PLAs May Be Bigger And Better Than You Think
As someone responsible for compiling, analyzing and putting narratives to raw marketing data, I spend a good portion of my time reviewing similar material from other sources in our industry. This is helpful for generating new ideas for analyses and serves as a basic sanity check of the results we are finding at RKG. On […]
As someone responsible for compiling, analyzing and putting narratives to raw marketing data, I spend a good portion of my time reviewing similar material from other sources in our industry. This is helpful for generating new ideas for analyses and serves as a basic sanity check of the results we are finding at RKG.
On occasion, I’ll find that the numbers we are seeing on a given issue seem to lie outside the norms, and it can be a challenge to determine exactly why, given the limited context that comes with many industry reports.
A prominent example of this has been with Google’s Product Listing Ads (PLAs). RKG stats have appeared to be among the most bullish on the impact PLAs are having in the paid search space. To explain why, I’d thought I’d use this opportunity to provide more context on PLAs than we’ve released elsewhere.
I hope this post also serves to underscore how, with any data analysis, there are many approaches that will yield perfectly accurate results; the greater challenge is determining the approach that will provide the most meaningful view of the numbers.
The Brand, Non-Brand Distinction
In the quarterly Digital Marketing Reports we have released at RKG over the last couple of years, we have been presenting PLA performance in comparison to non-brand text ads. The rationale here is that although PLAs can and do trigger for advertisers’ own brand terms, particularly for manufacturers, the vast majority of PLA impressions and clicks occur for non-brand queries.
A typical site sees branded queries drive just 2% of PLA clicks vs. 30% of text ad clicks (median values in Q4). Larger, better-known brands often see brand queries drive 50-60% of text ad clicks due to the brand equity they’ve developed over the years and largely outside of paid search.
So, to the extent that PLAs are competing with or displacing text ads, it is occurring on non-brand queries, and branded traffic share on text ads can be highly variable from site to site. All of this is important because metrics for branded traffic look quite a bit different than those for non-brand traffic: brand click-through rates (CTR) are considerably higher, brand cost-per-click (CPC) is usually much lower, and brand return on investment (ROI) generally looks much better on paper.
As such, comparing key metrics for PLAs to text ads appears very different depending on whether we exclude brand traffic:

Overall, CPCs for PLAs were 60% higher than those for text ads in Q4, CTR was 78% higher, but ROI was 64% lower. But looking only at more comparable non-brand text ads, PLA CPCs were just 13% higher, CTR is nearly 3.5X that of text ads, and ROI is 18% higher. For anyone concerned that the growth of PLAs might somehow be hurting their paid search program, the latter figures should provide comfort.
Including brand traffic in PLA analyses also naturally leads to PLAs having a lower traffic share than the same comparison for non-brand traffic. This may lead to a misleading perspective on the importance of PLAs to the paid search traffic over which advertisers exercise control.
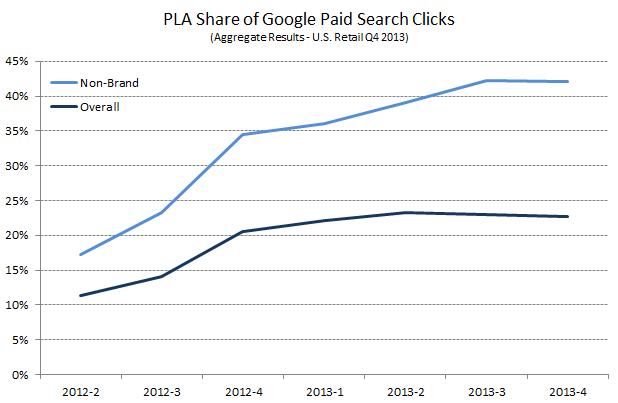
Looking at U.S. retail sites running both PLAs and text ads with RKG, we find that PLA share of non-brand Google paid search clicks was 42% in Q4 2013, compared to just 23% of total Google paid search clicks. An individual site with relatively high brand awareness may see PLA share of overall traffic run lower than normal even when they have a robust program.
Industry & Sub-Industry Matter
Product Listings Ads are only relevant for sites with, well, physical products to sell. An analysis of PLA volume share that includes data from travel, finance and/or lead gen sites won’t be terribly helpful for retailers trying to gauge their own program against their competitive set. Further, even within retail, PLAs are having very different impacts across sub-industries:

Again, among sites running both PLAs and text ads, RKG found that apparel and automotive retailers generated the lowest percentage of their non-brand Google clicks from PLAs in Q4 2013, with PLA click share at 31% and 22% for the two sub-industries, respectively. In contrast, electronics, health and beauty, and home and garden retailers all saw PLA click share hit a little over 50%.
Although our data is pretty robust here (RKG has been estimated as managing more PLAs than any other agency in the U.S.), we do see some variance within sub-industries and your results may vary. Generally though, PLAs hold the greatest potential for sites with traditionally SKU-heavy product offerings and search programs. This distinction is clear in the large spread between apparel and electronics retailers shown above.
PLAs Going Into 2014
RKG found PLA click share remaining flat for Q3 to Q4 2013; but, that is in part a reflection of the relative improvement in revenue-per-click for text ads during the holiday shopping season, which makes otherwise marginal text clicks profitable to advertisers. (In 2012, PLA click share jumped from Q3 to Q4 due to the one-time addition of the previously free Google Product Search traffic during the Google Shopping transition).
PLA click share was also kept in check in Q4 2013 by rising average cost-per-click as the competition for the format heated up:

As we move forward into the new year, expect PLAs to again take both click and spend share from text ads, particularly as Google continues to refine the management and display of the format.
On the management side, Google introduced Google Shopping campaigns in late October of last year to help make PLA management easier for certain advertisers, especially those relying upon the AdWords UI to run their program. For more sophisticated advertisers, the new model does appear to be a step toward addressing Google’s sometimes inconsistent PLA target serving; but, Google will need to iterate a bit to deliver more control to the advertiser.
In terms of exposure, we’ve already seen Google testing showing PLAs above the organic and text ad listings on the left side of the SERP, expanding the display of PLAs on mobile. And, Google appears to be expanding their use of 360 degree product views within Google Shopping. Also, the fact that PLA ROI still outpaces that for comparable text ads suggests the market has room to mature, and there is still upside potential for relative CPC growth.
Finally, as always, Google holds the ability to dramatically shake up the landscape for PLAs as they did last year for AdWords generally with Enhanced Campaigns. Since the Google Shopping transition in 2012, there has been plenty of speculation about whether they will move to a more full-on Google Marketplace. That remains to be seen, but it’s clear that PLAs will continue to grow in importance for the foreseeable future.
Opinions expressed in this article are those of the guest author and not necessarily Search Engine Land. Staff authors are listed here.
Related stories
New on Search Engine Land
About the author