How To Analyze Your Content Performance In Google Analytics
Google Analytics is divided in five main categories: Visitors Advertising Traffic Sources Content Conversions In this post, I want to talk about the Content category. I will not discuss all the reports available, but the ones I use most frequently. If you click on Content it will expand to the sections below: Overview The overview […]
Google Analytics is divided in five main categories:
- Visitors
- Advertising
- Traffic Sources
- Content
- Conversions
In this post, I want to talk about the Content category. I will not discuss all the reports available, but the ones I use most frequently.
If you click on Content it will expand to the sections below:
Overview
The overview gives a quick overall view of your content. You can see metrics such as pageviews, unique pageviews, avg. time on page and bounce rate. By using the date range option on the top right corner, you can select your date range and also easily compare to past dates.
In the overview you have the option to click on page, page title, search term, event category or Adsense page. You will get a summary of the report and with one click you go to the full report.
Site Content
Site content reports consist of:
- Pages
- Content Drilldown
- Landing Pages
- Exit Pages
Pages
If you want to know which pages are visited the most on your website, this is the report for you. Below a screenshot of the top bar in Google Analytics when you click on Pages. These metrics you get for every page.
![]()
You can easily change the appearance of your data by using the view option.![]()
There are five different views. Data (this is the standard view), Percentage, Performance, Comparison and Pivot.
I really like the Comparison view, because it’s easy to compare page performance against the site average. It’s great to get quick insights about which pages are performing well above or below site average regarding metrics such as Avg. Time on page, bounce rate and % of exits.
Landing Pages
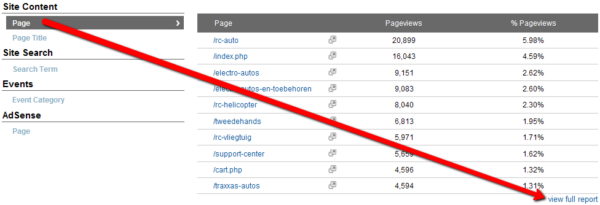
In the landing pages option, you can see which pages are the most popular landing pages for your website and their performance. You can click on every page and by choosing secondary dimension you have many options to filter.
If you e.g. want to know which traffic sources are bringing the most traffic to your homepage, just click on the homepage and select source. (see screenshot)

Great thing about this report is that E-commerce data is included, so you see which pages bring you transactions and revenue.
Site Speed
In May 2011, Google announced the site speed option in the new Google Analytics interface. You can measure this by adding the line _trackPageLoadTime(); to your tracking code. Click here for the detailed instructions.
In this report, the average page load time of your pages is shown. Google has officially announced that site speed is a signal in their search ranking algorithms, so I definitely recommend to start measuring the speed of your pages. After all, nobody likes slow loading pages.
Site Search
If you have a search engine on your website which visitors can use to search the site, you can measure the usage of this feature. The results you can find under the Site Search category in Google Analytics.
Site Search consists of:
- Overview
- Usage
- Search Terms
- Pages
Overview
In the overview, you see the percentage of visits with and without site search. Also some other metrics such as % search exits, % search refinements, time after search and search depth.
Usage
Usage also provides you with the percentage of visits with and without site search, but you have more options to filter your data through secondary dimension. Also, you have the view option to change the appearance of your data which I mentioned earlier in this post. And there is an E-commerce tab that gives you transactions, revenue and conversion rate data.
Search Terms
This report gives you the search terms people use to search your website. It’s a great way to find out what people are searching for. This report also provides you with the metrics % search exits, % search refinements, time after search and search depth for every search term.
With this information you can analyze the top search terms. For example, you can compare the % search exits for a particular search term to site average. If it’s very high, maybe your search engine is not giving the best results for the query.
Events
If you have event tracking enabled, you will use this report to see the results of your events.
The events category consists of:
- Overview
- Top Events
- Pages
With event tracking, you can measure all kinds of activity on your website such as PDF downloads, printing pages, interaction with a slidehow, watching videos and much more.
If you want to implement Event Tracking you can click here for all the details. I recommend first to decide all the things you want to track on your site using event tracking. This will help to create a clear report in Google Analytics after Event Tracking is implemented.
The Content category provides so many information about the performance of your website to keep you busy analyzing it for a long time. It’s a great place to find new insights and take action on it.
Opinions expressed in this article are those of the guest author and not necessarily Search Engine Land. Staff authors are listed here.
Related stories
About the author